Justification
For
Understanding Real Needs


Use evidence of needs to justify resources (investments, time, money).
Data Story Format
"We are seeking and gathering data from ___[our community]__via [survey/dataset]__ so that we understand the real needs and can ask for ____[resources]____ to accomplish ___[goal]_____."
Possible Use
We are seeking and gathering data from our community via a technology survey so that we understand the real needs and can ask for funding for technology upgrades, digital resources, and staff training in technologies that people in our community need.
Real Story Examples
Closer to Home: Libraries Providing Home Broadband: The COVID pandemic made it clear that access to fast, reliable internet is a necessity. Libraries have redoubled their efforts to bridge the digital divide, and three programs in particular provided broadband internet to populations across the United States, using radio service, outdoor fixed wireless antennas, and fiber-optic networks, respectively. Other rural libraries also use base station antennas to provide broadband access via radio frequencies.
Communities (Small Business Resource Center): Wilcox County is one of the poorest counties in Alabama and has one of the highest unemployment rates in the U.S. The area is very rural with few local businesses and is not conducive to commuting to jobs in other areas. The Wilcox County Library, serving approximately 12,000 patrons, piloted a project to help residents learn skills that will enable them to set up small home-based or online businesses.
Distributing Gun Locks at the Library: In 2023, there has been at least 32,000 gun-related deaths within America. In response to these horrific numbers and as a member of their county's Gun Violence Intervention Team, Anne Arundel County (MD) Public Library began to give out free gun locks to help prevent gun-related death and violence within their abilities.
Sowing Seeds for Community Impact: Seed collections and exchanges are a newer public library service that continue to benefit patrons and focus on sustainability practices. This article highlights public libraries and counties across the nation that have organized seed distributions and collections and explains how libraries can create similar programs for their own patrons through collecting seeds, marketing the event, and promoting the possibilities these programs offer.
Data Visualization Recommendations
General Guidance
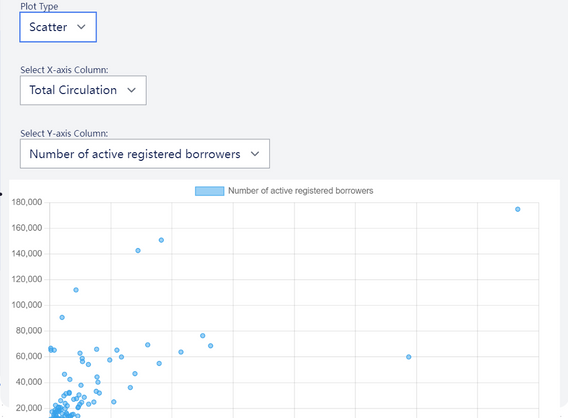
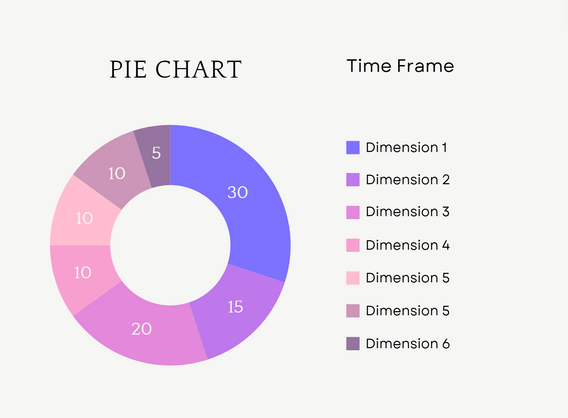
Justification: Consider using a bar chart, donut chart, or line chart to show the emergence of the new or previously invisible need over time. In general, line charts are the best choice for indicating change over time.


